> ## Documentation Index
> Fetch the complete documentation index at: https://docs.valuez.ai/llms.txt
> Use this file to discover all available pages before exploring further.
# Dashboard Overview
> A complete guide to every metric and section on your Valuez AI dashboard.
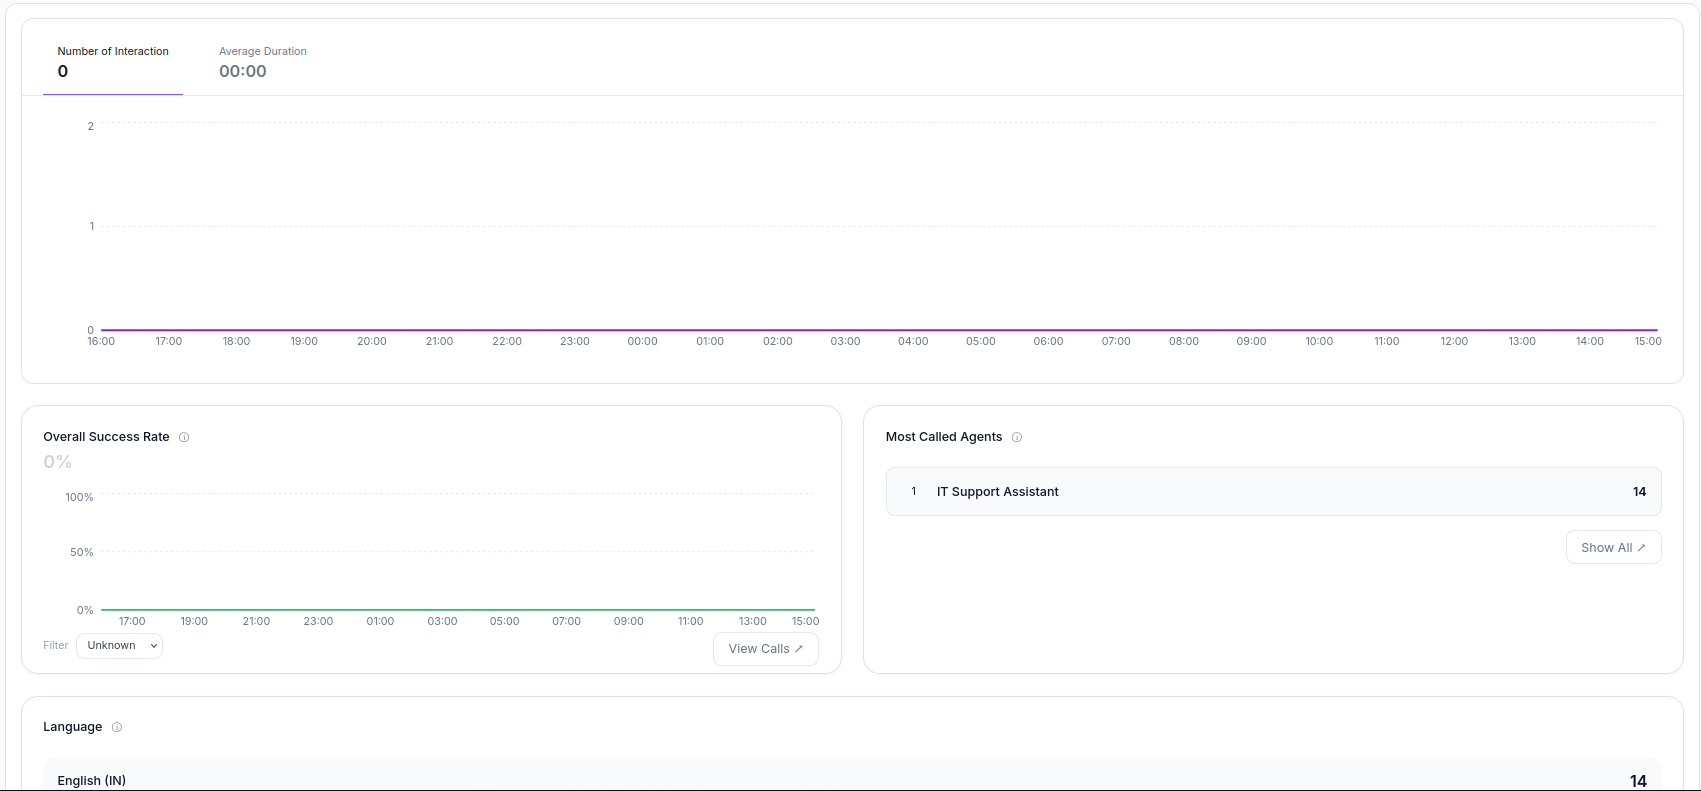
The Valuez AI dashboard is your central control center. It gives you a real-time snapshot of how your AI agents are performing, how many interactions have happened, and where your calls are coming from, all in one screen.
 ***
## Filters (Top Right)
Before reading any metrics, set the scope of what you want to see using the two filters at the top right:
| Filter | What It Does |
| ---------------- | --------------------------------------------------------------------- |
| **All Agents ▾** | Filter dashboard data by a specific agent or view all agents together |
| **1 Day ▾** | Set the time range - e.g. 1 Day, 1 Week, 1 Month, 6 Months |
Changing either filter updates all charts and metrics on the page instantly.
***
## Summary Pills (Top Left)
Two quick-glance numbers are always visible at the very top:
| Pill | What It Shows |
| ------------------ | -------------------------------------------------------------------------------------- |
| **Total Agents** | The number of AI agents currently set up in your workspace |
| **Total Requests** | The total number of call requests handled across all agents in the selected time range |
These give you an instant headline view before you read any charts.
***
## Interactions Chart
The main chart tracks call activity over time across your selected time range.
***
## Filters (Top Right)
Before reading any metrics, set the scope of what you want to see using the two filters at the top right:
| Filter | What It Does |
| ---------------- | --------------------------------------------------------------------- |
| **All Agents ▾** | Filter dashboard data by a specific agent or view all agents together |
| **1 Day ▾** | Set the time range - e.g. 1 Day, 1 Week, 1 Month, 6 Months |
Changing either filter updates all charts and metrics on the page instantly.
***
## Summary Pills (Top Left)
Two quick-glance numbers are always visible at the very top:
| Pill | What It Shows |
| ------------------ | -------------------------------------------------------------------------------------- |
| **Total Agents** | The number of AI agents currently set up in your workspace |
| **Total Requests** | The total number of call requests handled across all agents in the selected time range |
These give you an instant headline view before you read any charts.
***
## Interactions Chart
The main chart tracks call activity over time across your selected time range.
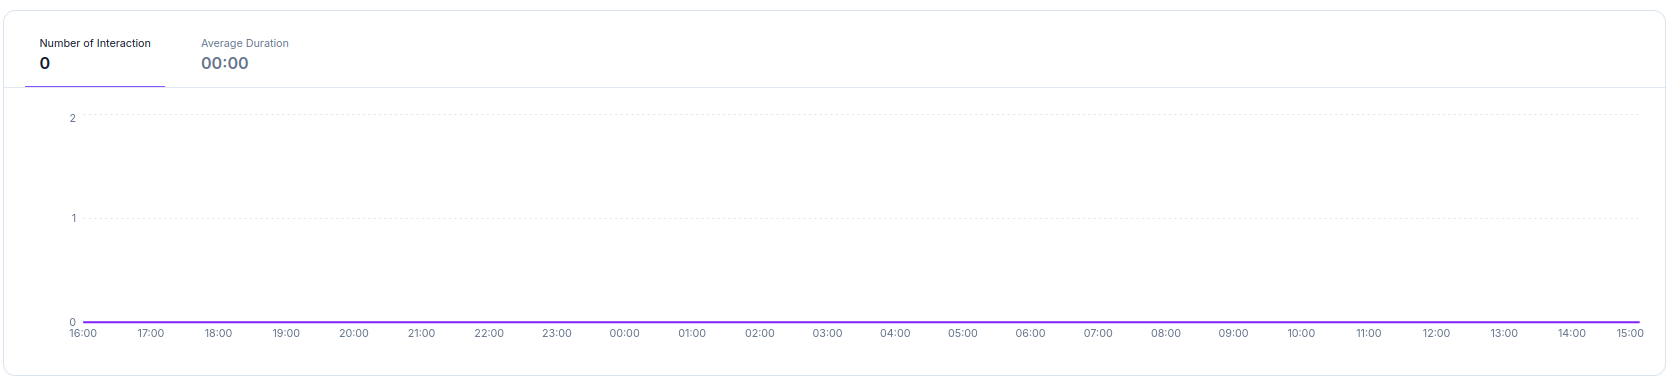 It shows two values above the chart:
| Metric | What It Means |
| -------------------------- | --------------------------------------------------------- |
| **Number of Interactions** | Total calls handled by your agents in the selected period |
| **Average Duration** | The average length of each call in `mm:ss` format |
The X-axis shows time (hour by hour across your selected range). The Y-axis shows call volume. Use this chart to spot busy periods, traffic spikes, and off-peak hours.
If **Number of Interactions** is 0 and the chart is flat, your agents haven't received or made any calls yet in the selected time window. Switch the time filter to a wider range to check historical data.
***
## Overall Success Rate
Located bottom left, this chart shows what percentage of calls were handled successfully by your AI agents.
| Element | What It Means |
| ------------------- | ---------------------------------------------------------------------------------- |
| **Success Rate %** | Percentage of calls where the agent completed its task without failing or dropping |
| **Time axis** | Tracks success rate changes hour by hour across the selected period |
| **Filter dropdown** | You can see failure and success inside this |
| **View Calls ↗** | Clicks through to your full call logs filtered to this agent and time range |
A low or 0% success rate early on is normal — it improves as your agent's prompt and knowledge base are refined through real call data.
***
## Most Called Agents
Located bottom right, this panel ranks your agents by the number of calls they've handled.
| Column | What It Shows |
| -------------- | ------------------------------------------------------------ |
| **Rank** | Position by call volume (1 = most active) |
| **Agent Name** | The name you gave the agent when creating it |
| **Call Count** | Total calls handled by that agent in the selected time range |
Click **Show All ↗** to see the full ranked list if you have more than a few agents.
Use this panel to identify which agents are doing the most work. If one agent is handling significantly more calls than others, consider duplicating and distributing the load.
***
## Language Breakdown
At the bottom of the dashboard, the **Language** panel shows a breakdown of calls by the language your agents are configured for.
| Column | What It Shows |
| ------------ | --------------------------------------------------------------------------- |
| **Language** | The language setting of the agent that handled the call e.g. `English (IN)` |
| **Calls** | Number of calls handled in that language within the selected time range |
This helps you understand your customer language distribution and whether you need agents configured for additional languages.
***
## Dashboard Quick Reference
Here's a one-line summary of every section:
| Section | What to Look At |
| ------------------------ | ------------------------------------------------ |
| **Total Agents** | How many agents you have set up |
| **Total Requests** | Overall call volume in the selected period |
| **Interactions Chart** | When calls happen and how long they last |
| **Overall Success Rate** | How well your agents are completing their tasks |
| **Most Called Agents** | Which agents are handling the most load |
| **Language Breakdown** | Which languages your call volume is split across |
***
## Next Steps
View, edit, and configure your AI voice agents.
Drill into individual call transcripts, recordings, and outcomes.
Set up and manage inbound call routing to your agents.
Run outbound calling campaigns via dashboard or API.
It shows two values above the chart:
| Metric | What It Means |
| -------------------------- | --------------------------------------------------------- |
| **Number of Interactions** | Total calls handled by your agents in the selected period |
| **Average Duration** | The average length of each call in `mm:ss` format |
The X-axis shows time (hour by hour across your selected range). The Y-axis shows call volume. Use this chart to spot busy periods, traffic spikes, and off-peak hours.
If **Number of Interactions** is 0 and the chart is flat, your agents haven't received or made any calls yet in the selected time window. Switch the time filter to a wider range to check historical data.
***
## Overall Success Rate
Located bottom left, this chart shows what percentage of calls were handled successfully by your AI agents.
| Element | What It Means |
| ------------------- | ---------------------------------------------------------------------------------- |
| **Success Rate %** | Percentage of calls where the agent completed its task without failing or dropping |
| **Time axis** | Tracks success rate changes hour by hour across the selected period |
| **Filter dropdown** | You can see failure and success inside this |
| **View Calls ↗** | Clicks through to your full call logs filtered to this agent and time range |
A low or 0% success rate early on is normal — it improves as your agent's prompt and knowledge base are refined through real call data.
***
## Most Called Agents
Located bottom right, this panel ranks your agents by the number of calls they've handled.
| Column | What It Shows |
| -------------- | ------------------------------------------------------------ |
| **Rank** | Position by call volume (1 = most active) |
| **Agent Name** | The name you gave the agent when creating it |
| **Call Count** | Total calls handled by that agent in the selected time range |
Click **Show All ↗** to see the full ranked list if you have more than a few agents.
Use this panel to identify which agents are doing the most work. If one agent is handling significantly more calls than others, consider duplicating and distributing the load.
***
## Language Breakdown
At the bottom of the dashboard, the **Language** panel shows a breakdown of calls by the language your agents are configured for.
| Column | What It Shows |
| ------------ | --------------------------------------------------------------------------- |
| **Language** | The language setting of the agent that handled the call e.g. `English (IN)` |
| **Calls** | Number of calls handled in that language within the selected time range |
This helps you understand your customer language distribution and whether you need agents configured for additional languages.
***
## Dashboard Quick Reference
Here's a one-line summary of every section:
| Section | What to Look At |
| ------------------------ | ------------------------------------------------ |
| **Total Agents** | How many agents you have set up |
| **Total Requests** | Overall call volume in the selected period |
| **Interactions Chart** | When calls happen and how long they last |
| **Overall Success Rate** | How well your agents are completing their tasks |
| **Most Called Agents** | Which agents are handling the most load |
| **Language Breakdown** | Which languages your call volume is split across |
***
## Next Steps
View, edit, and configure your AI voice agents.
Drill into individual call transcripts, recordings, and outcomes.
Set up and manage inbound call routing to your agents.
Run outbound calling campaigns via dashboard or API.